Average deviation in excel formula. Calculation of standard deviation in Microsoft Excel
Let's calculate inMSEXCELsample variance and standard deviation. We will also calculate the variance of a random variable if its distribution is known.
Let's first consider dispersion, then standard deviation.
Sample variance
Sample variance (sample variance,samplevariance) characterizes the spread of values in the array relative to .
All 3 formulas are mathematically equivalent.
From the first formula it is clear that sample variance is the sum of the squared deviations of each value in the array from average, divided by sample size minus 1.
variances samples the DISP() function is used, English. the name VAR, i.e. VARiance. From version MS EXCEL 2010, it is recommended to use its analogue DISP.V(), English. the name VARS, i.e. Sample VARiance. In addition, starting from the version of MS EXCEL 2010, there is a function DISP.Г(), English. name VARP, i.e. Population VARiance, which calculates dispersion For population. The whole difference comes down to the denominator: instead of n-1 like DISP.V(), DISP.G() has just n in the denominator. Before MS EXCEL 2010, the VAR() function was used to calculate the variance of the population.
Sample variance
=QUADROTCL(Sample)/(COUNT(Sample)-1)
=(SUM(Sample)-COUNT(Sample)*AVERAGE(Sample)^2)/ (COUNT(Sample)-1)– usual formula
=SUM((Sample -AVERAGE(Sample))^2)/ (COUNT(Sample)-1) –
Sample variance is equal to 0, only if all values are equal to each other and, accordingly, equal average value. Usually, the larger the value variances, the greater the spread of values in the array.
Sample variance is a point estimate variances distribution of the random variable from which it was made sample. About construction confidence intervals when assessing variances can be read in the article.
Variance of a random variable
To calculate dispersion random variable, you need to know it.
For variances random variable X is often denoted Var(X). Dispersion equal to the square of the deviation from the mean E(X): Var(X)=E[(X-E(X)) 2 ]
dispersion calculated by the formula:

where x i is the value that a random variable can take, and μ is the average value (), p(x) is the probability that the random variable will take the value x.
If a random variable has , then dispersion calculated by the formula:

Dimension variances corresponds to the square of the unit of measurement of the original values. For example, if the values in the sample represent part weight measurements (in kg), then the variance dimension would be kg 2 . This can be difficult to interpret, so to characterize the spread of values, a value equal to the square root of variances – standard deviation.
Some properties variances:
Var(X+a)=Var(X), where X is a random variable and a is a constant.
Var(aХ)=a 2 Var(X)
Var(X)=E[(X-E(X)) 2 ]=E=E(X 2)-E(2*X*E(X))+(E(X)) 2 =E(X 2)- 2*E(X)*E(X)+(E(X)) 2 =E(X 2)-(E(X)) 2
This dispersion property is used in article about linear regression.
Var(X+Y)=Var(X) + Var(Y) + 2*Cov(X;Y), where X and Y are random variables, Cov(X;Y) is the covariance of these random variables.
If random variables are independent, then they covariance is equal to 0, and therefore Var(X+Y)=Var(X)+Var(Y). This property of dispersion is used in derivation.
Let us show that for independent quantities Var(X-Y)=Var(X+Y). Indeed, Var(X-Y)= Var(X-Y)= Var(X+(-Y))= Var(X)+Var(-Y)= Var(X)+Var(-Y)= Var( X)+(-1) 2 Var(Y)= Var(X)+Var(Y)= Var(X+Y). This dispersion property is used to construct .
Sample standard deviation
Sample standard deviation is a measure of how widely scattered the values in a sample are relative to their .
A-priory, standard deviation equal to the square root of variances:

Standard deviation does not take into account the magnitude of the values in sample, but only the degree of dispersion of values around them average. To illustrate this, let's give an example.
Let's calculate the standard deviation for 2 samples: (1; 5; 9) and (1001; 1005; 1009). In both cases, s=4. It is obvious that the ratio of the standard deviation to the array values differs significantly between samples. For such cases it is used The coefficient of variation(Coefficient of Variation, CV) - ratio Standard Deviation to the average arithmetic, expressed as a percentage.
In MS EXCEL 2007 and earlier versions for calculation Sample standard deviation the function =STDEVAL() is used, English. name STDEV, i.e. STandard DEViation. From the version of MS EXCEL 2010, it is recommended to use its analogue =STDEV.B() , English. name STDEV.S, i.e. Sample STandard DEViation.
In addition, starting from the version of MS EXCEL 2010, there is a function STANDARDEV.G(), English. name STDEV.P, i.e. Population STandard DEViation, which calculates standard deviation For population. The whole difference comes down to the denominator: instead of n-1 as in STANDARDEV.V(), STANDARDEVAL.G() has just n in the denominator.
Standard deviation can also be calculated directly using the formulas below (see example file)
=ROOT(QUADROTCL(Sample)/(COUNT(Sample)-1))
=ROOT((SUM(Sample)-COUNT(Sample)*AVERAGE(Sample)^2)/(COUNT(Sample)-1))
Other measures of scatter
The SQUADROTCL() function calculates with a sum of squared deviations of values from their average. This function will return the same result as the formula =DISP.G( Sample)*CHECK( Sample) , Where Sample- a reference to a range containing an array of sample values (). Calculations in the QUADROCL() function are made according to the formula:

The SROTCL() function is also a measure of the spread of a data set. The function SROTCL() calculates the average of the absolute values of deviations of values from average. This function will return the same result as the formula =SUMPRODUCT(ABS(Sample-AVERAGE(Sample)))/COUNT(Sample), Where Sample- a link to a range containing an array of sample values.
Calculations in the function SROTCL () are made according to the formula:

In this article I will talk about how to find standard deviation. This material is extremely important for a full understanding of mathematics, so a math tutor should devote a separate lesson or even several to studying it. In this article you will find a link to a detailed and understandable video tutorial that explains what standard deviation is and how to find it.
Standard deviation makes it possible to evaluate the spread of values obtained as a result of measuring a certain parameter. Indicated by the symbol (Greek letter "sigma").
The formula for calculation is quite simple. To find the standard deviation, you need to take the square root of the variance. So now you have to ask, “What is variance?”
What is variance
The definition of variance goes like this. Dispersion is the arithmetic mean of the squared deviations of values from the mean.
To find the variance, perform the following calculations sequentially:
- Determine the average (simple arithmetic average of a series of values).
- Then subtract the average from each value and square the resulting difference (you get squared difference).
- The next step is to calculate the arithmetic mean of the resulting squared differences (You can find out why exactly the squares below).
Let's look at an example. Let's say you and your friends decide to measure the height of your dogs (in millimeters). As a result of the measurements, you received the following height measurements (at the withers): 600 mm, 470 mm, 170 mm, 430 mm and 300 mm.
Let's calculate the mean, variance and standard deviation.
First let's find the average value. As you already know, to do this you need to add up all the measured values and divide by the number of measurements. Calculation progress:
Average mm.
So, the average (arithmetic mean) is 394 mm.
Now we need to determine deviation of the height of each dog from the average:

Finally, to calculate variance, we square each of the resulting differences, and then find the arithmetic mean of the results obtained:
Dispersion mm 2 .
Thus, the dispersion is 21704 mm 2.
How to find standard deviation
So how can we now calculate the standard deviation, knowing the variance? As we remember, take the square root of it. That is, the standard deviation is equal to:
Mm (rounded to the nearest whole number in mm).
Using this method, we found that some dogs (for example, Rottweilers) are very large dogs. But there are also very small dogs (for example, dachshunds, but you shouldn’t tell them that).
The most interesting thing is that the standard deviation carries useful information. Now we can show which of the obtained height measurement results are within the interval that we get if we plot the standard deviation from the average (to both sides of it).
That is, using the standard deviation, we obtain a “standard” method that allows us to find out which of the values is normal (statistical average), and which is extraordinarily large or, conversely, small.
What is standard deviation
But... everything will be a little different if we analyze sample data. In our example we considered general population. That is, our 5 dogs were the only dogs in the world that interested us.
But if the data is a sample (values selected from a large population), then the calculations need to be done differently.
If there are values, then:
All other calculations are carried out similarly, including the determination of the average.
For example, if our five dogs are just a sample of the population of dogs (all dogs on the planet), we must divide by 4, not 5, namely:
Sample variance =  mm 2.
mm 2.
In this case, the standard deviation for the sample is equal to  mm (rounded to the nearest whole number).
We can say that we have made some “correction” in the case where our values are just a small sample.
Note. Why exactly squared differences?
But why do we take exactly the squared differences when calculating the variance? Let's say when measuring some parameter, you received the following set of values: 4; 4; -4; -4. If we simply add the absolute deviations from the mean (differences) together... the negative values cancel out with the positive ones:
 .
.
It turns out that this option is useless. Then maybe it’s worth trying the absolute values of the deviations (that is, the modules of these values)?
At first glance, it turns out well (the resulting value, by the way, is called the mean absolute deviation), but not in all cases. Let's try another example. Let the measurement result in the following set of values: 7; 1; -6; -2. Then the average absolute deviation is:
Wow! Again we got a result of 4, although the differences have a much larger spread.
Now let's see what happens if we square the differences (and then take the square root of their sum).
For the first example it will be:
 .
.
For the second example it will be:
Now it’s a completely different matter! The greater the spread of the differences, the greater the standard deviation is... which is what we were aiming for.
In fact, this method uses the same idea as when calculating the distance between points, only applied in a different way.
And from a mathematical point of view, using squares and square roots provides more benefits than we could get from absolute deviation values, making standard deviation applicable to other mathematical problems.
Sergey Valerievich told you how to find the standard deviation
The Excel program is highly valued by both professionals and amateurs, because users of any skill level can work with it. For example, anyone with minimal “communication” skills in Excel can draw a simple graph, make a decent plate, etc.
At the same time, this program even allows you to perform various types of calculations, for example, calculations, but this requires a slightly different level of training. However, if you have just begun to become closely acquainted with this program and are interested in everything that will help you become a more advanced user, this article is for you. Today I will tell you what the standard deviation formula in Excel is, why it is needed at all and, strictly speaking, when it is used. Go!
What it is
Let's start with the theory. The standard deviation is usually called the square root obtained from the arithmetic mean of all squared differences between the available quantities, as well as their arithmetic mean. By the way, this value is usually called the Greek letter “sigma”. The standard deviation is calculated using the STANDARDEVAL formula; accordingly, the program does this for the user itself.
The essence of this concept is to identify the degree of variability of an instrument, that is, it is, in its own way, an indicator derived from descriptive statistics. It identifies changes in the volatility of an instrument over a certain time period. The STDEV formulas can be used to estimate the standard deviation of a sample, ignoring Boolean and text values.
Formula
The formula that is automatically provided in Excel helps to calculate the standard deviation in Excel. To find it, you need to find the formula section in Excel, and then select the one called STANDARDEVAL, so it’s very simple.
After this, a window will appear in front of you in which you will need to enter data for the calculation. In particular, two numbers should be entered in special fields, after which the program itself will calculate the standard deviation for the sample.

Undoubtedly, mathematical formulas and calculations are a rather complex issue, and not all users can cope with it straight away. However, if you dig a little deeper and look at the issue in a little more detail, it turns out that not everything is so sad. I hope you are convinced of this using the example of calculating the standard deviation.
Video to help
Instructions
Let there be several numbers characterizing homogeneous quantities. For example, the results of measurements, weighings, statistical observations, etc. All quantities presented must be measured using the same measurement. To find the standard deviation, do the following:
Determine the arithmetic mean of all numbers: add all the numbers and divide the sum by the total number of numbers.
Determine the dispersion (scatter) of numbers: add the squares of the previously found deviations and divide the resulting sum by the number of numbers.
There are seven patients in the ward with temperatures of 34, 35, 36, 37, 38, 39 and 40 degrees Celsius.
It is required to determine the average deviation from the mean.
Solution:
“in the ward”: (34+35+36+37+38+39+40)/7=37 ºС;
Temperature deviations from the average (in this case, the normal value): 34-37, 35-37, 36-37, 37-37, 38-37, 39-37, 40-37, resulting in: -3, -2, -1 , 0, 1, 2, 3 (ºС);
Divide the sum of numbers obtained earlier by their number. For accurate calculations, it is better to use a calculator. The result of division is the arithmetic mean of the numbers added.
Pay attention to all stages of the calculation, since an error in even one of the calculations will lead to an incorrect final indicator. Check your calculations at every stage. The arithmetic average has the same meter as the summed numbers, that is, if you determine the average attendance, then all your indicators will be “person”.
This calculation method is used only in mathematical and statistical calculations. For example, the arithmetic mean in computer science has a different calculation algorithm. The arithmetic mean is a very relative indicator. It shows the probability of an event, provided that it has only one factor or indicator. For the most in-depth analysis, many factors must be taken into account. For this purpose, the calculation of more general quantities is used.
The arithmetic mean is one of the measures of central tendency, widely used in mathematics and statistical calculations. Finding the arithmetic average for several values is very simple, but each task has its own nuances, which are simply necessary to know in order to perform correct calculations.
Quantitative results of similar experiments.
How to find the arithmetic mean
Finding the arithmetic mean for an array of numbers should begin by determining the algebraic sum of these values. For example, if the array contains the numbers 23, 43, 10, 74 and 34, then their algebraic sum will be equal to 184. When writing, the arithmetic mean is denoted by the letter μ (mu) or x (x with a bar). Next, the algebraic sum should be divided by the number of numbers in the array. In the example under consideration there were five numbers, so the arithmetic mean will be equal to 184/5 and will be 36.8.Features of working with negative numbers
If the array contains negative numbers, then the arithmetic mean is found using a similar algorithm. The difference only exists when calculating in the programming environment, or if the problem has additional conditions. In these cases, finding the arithmetic mean of numbers with different signs comes down to three steps:1. Finding the general arithmetic average using the standard method;
2. Finding the arithmetic mean of negative numbers.
3. Calculation of the arithmetic mean of positive numbers.
The responses for each action are written separated by commas.
Natural and decimal fractions
If an array of numbers is represented by decimal fractions, the solution is carried out using the method of calculating the arithmetic mean of integers, but the result is reduced according to the task’s requirements for the accuracy of the answer.When working with natural fractions, they should be reduced to a common denominator, which is multiplied by the number of numbers in the array. The numerator of the answer will be the sum of the given numerators of the original fractional elements.
One of the main tools of statistical analysis is the calculation of standard deviation. This indicator allows you to estimate the standard deviation for a sample or for a population. Let's learn how to use the standard deviation formula in Excel.
Let’s immediately determine what the standard deviation is and what its formula looks like. This quantity is the square root of the arithmetic mean of the squares of the difference between all quantities in the series and their arithmetic mean. There is an identical name for this indicator - standard deviation. Both names are completely equivalent.
But, naturally, in Excel the user does not have to calculate this, since the program does everything for him. Let's learn how to calculate standard deviation in Excel.
Calculation in Excel
You can calculate the specified value in Excel using two special functions STDEV.V(based on the sample population) and STDEV.G(based on the general population). The principle of their operation is absolutely the same, but they can be called in three ways, which we will discuss below.
Method 1: Function Wizard


Method 2: Formulas Tab


Method 3: Manually entering the formula
There is also a way in which you won't need to call the arguments window at all. To do this, you must enter the formula manually.
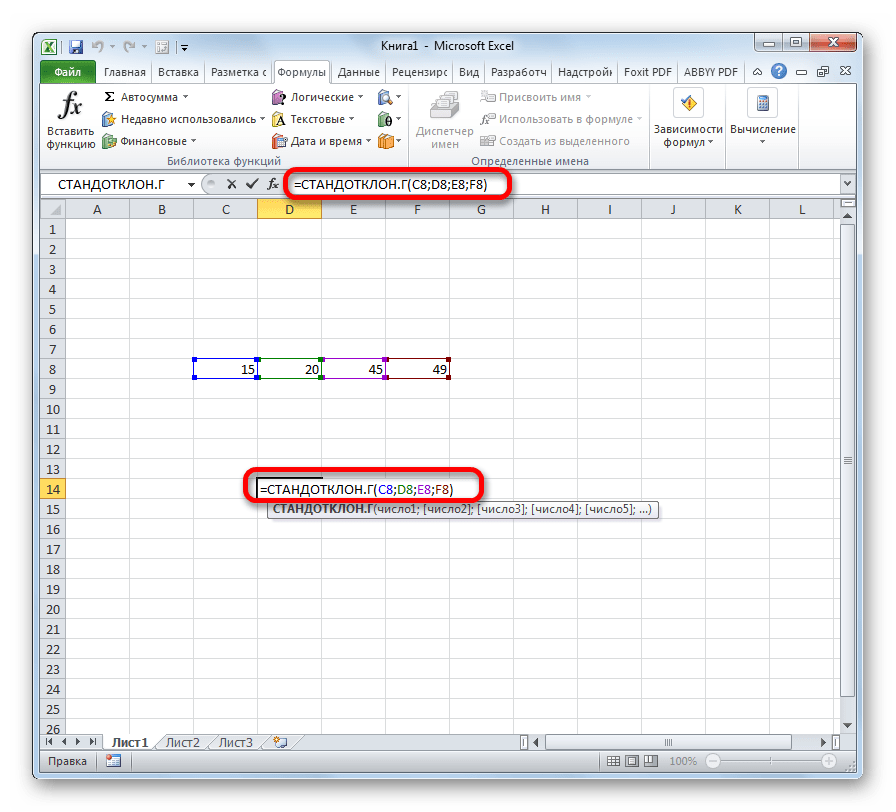

As you can see, the mechanism for calculating standard deviation in Excel is very simple. The user only needs to enter numbers from the population or references to the cells that contain them. All calculations are performed by the program itself. It is much more difficult to understand what the calculated indicator is and how the calculation results can be applied in practice. But understanding this already relates more to the field of statistics than to learning to work with software.